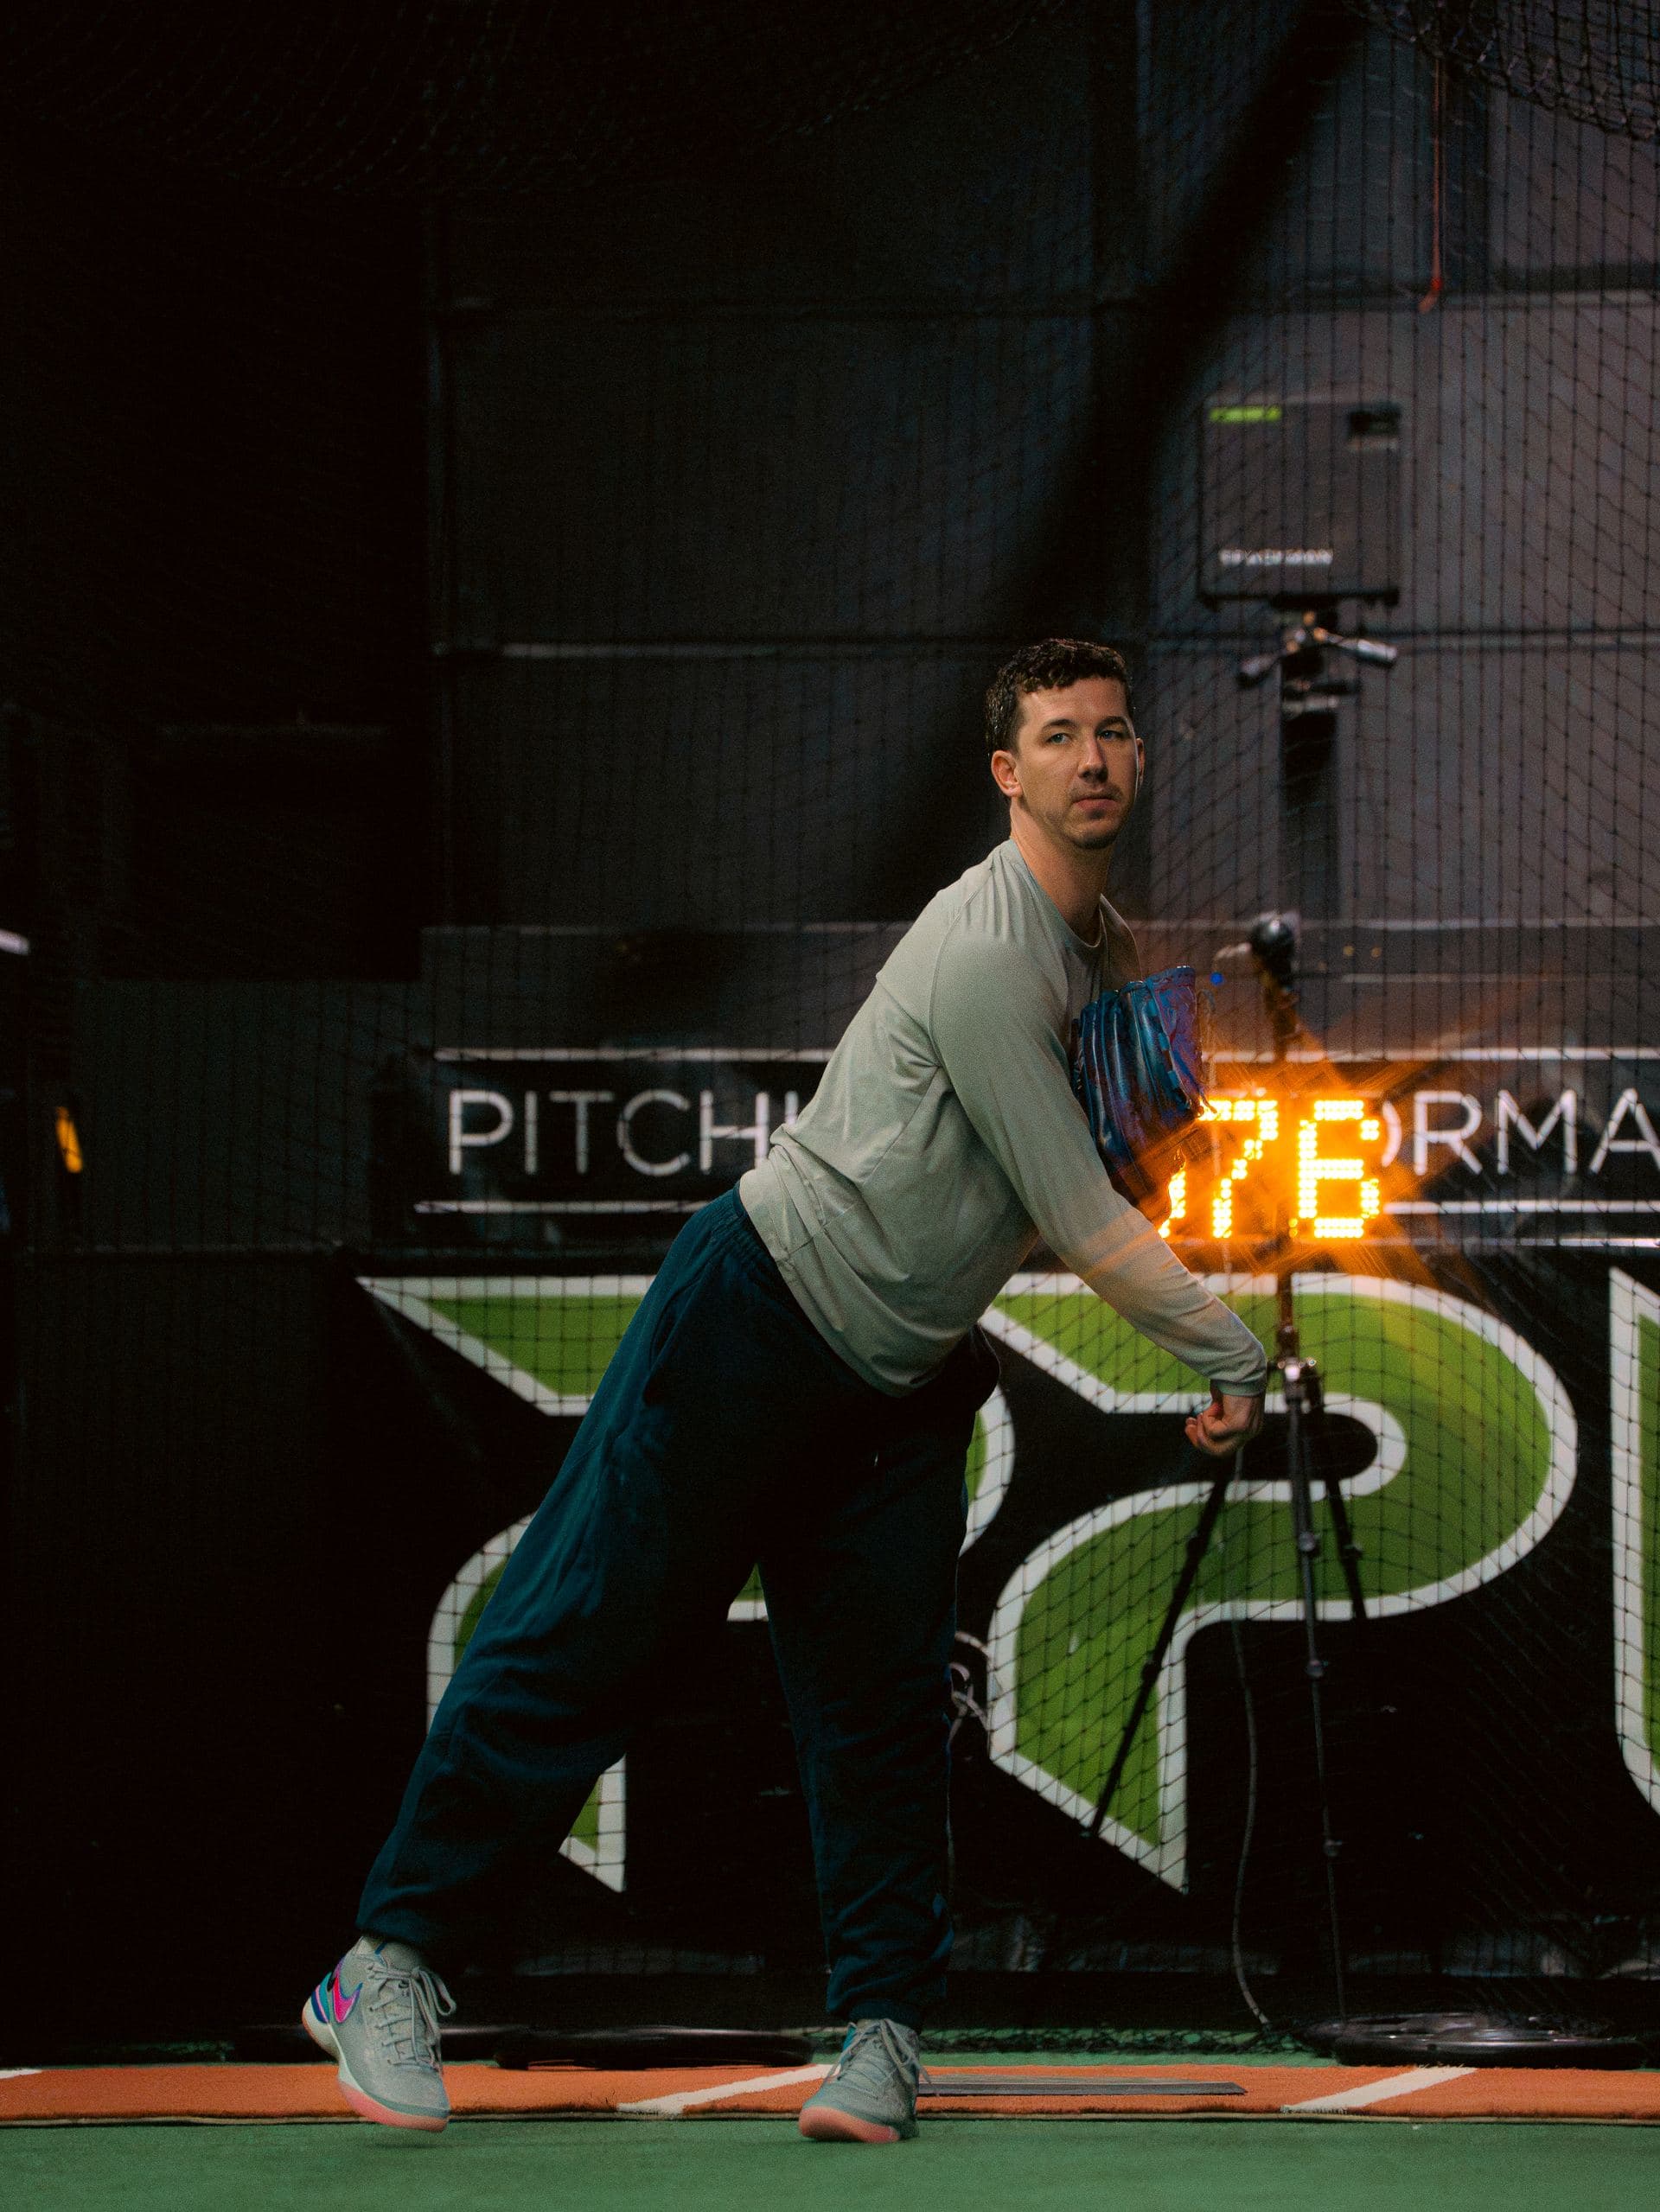
A pitcher finishing a throw at PPL with the velocity readout glowing on the wall behind him

Velocity by age

How hard should my kid be throwing?

Every parent wants a number to compare against, and the numbers on the internet are all over the place. Here is what the better data actually says, and the honest reason it can only tell you so much about your own athlete.

3,000+Athletes trained
400+College commits
50+Pro baseball players

What the data says

Low to mid 60s at thirteen, mid 80s by eighteen

One of the larger public looks at this pulled fastball readings from showcase events for pitchers thirteen to eighteen. The middle of the pack at thirteen sat around 65 mph, with a quarter of pitchers near 60 and a quarter near 70. The typical pitcher added roughly five or six mph a year through sixteen, then two or three a year after that, and the middle of the pack at eighteen was in the mid to upper 80s. Keep in mind who is in that sample: kids good enough to be at showcases, so the average high school pitcher throws a little slower than these numbers.

Why the chart misleads

Growth is the biggest variable at this age

Two thirteen year olds can be three years apart physically. The early bloomer throws hard first and looks like a prospect, and the late bloomer looks behind until his growth spurt arrives and he passes half the field in a year. A velocity chart by age cannot see any of that, which is why a single number at thirteen predicts very little about seventeen.

A better comparison

Compare your pitcher to himself

The question that actually matters is whether your athlete is moving forward and staying healthy. We put every bullpen on Trackman so his own numbers are tracked over months, next to video of the delivery. Steady progress on his own line is a much better sign than where he lands on somebody else's chart this spring.

What actually moves it

Movement, strength and a delivery that holds

Velocity comes from how well an athlete moves, how strong he is in the right places and how efficiently his delivery transfers that into the ball. Chasing a number by throwing harder and more often is how young arms get hurt. We start with a movement assessment from a physical therapist and build from what it finds.

Questions parents ask

Straight answers

How fast does the average 13 year old pitcher throw?

Showcase data puts competitive thirteen year olds around 60 to 70 mph, with the middle near 65. The average thirteen year old who is not at showcases usually throws somewhat slower, and growth makes a big difference at this age.

How fast should a 14 or 15 year old throw?

Among competitive pitchers the middle of the pack climbs roughly five or six mph a year from thirteen to sixteen, so most land somewhere in the high 60s to mid 70s at fourteen and fifteen. Where a kid is in his growth matters more than his birthday.

How hard do you need to throw to pitch in college?

It depends a great deal on the level and the pitcher. Velocity opens doors, but command, movement and pitchability decide who stays on a roster. We would rather tell you honestly where your athlete is than quote one number for every college.

My kid throws slower than his friends. Should I worry?

Usually not. Late maturing kids often throw slower early and catch up fast once they grow. What matters is steady progress, a healthy arm and a delivery that is getting more efficient, and all three can be measured.

Get a real number, and what is behind it

The free assessment puts your athlete on Trackman and high speed video. You leave with his velocity, what is limiting it and what we would work on first.

Book the free assessment